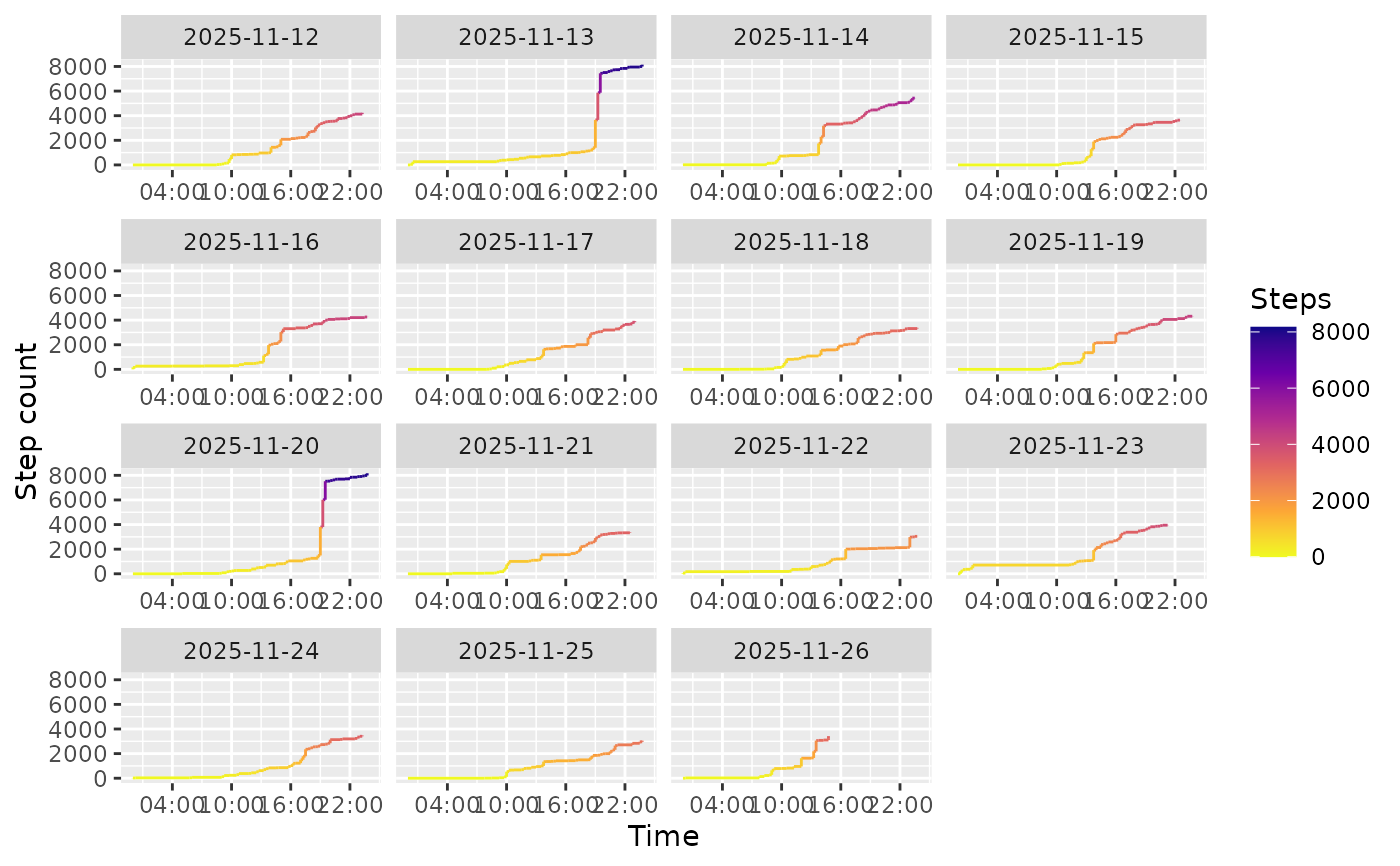
Creates a visualization of cumulative step counts over time from wearable data. The chart displays steps as a line graph with the cumulative count building up throughout each day.
Usage
steps_chart(
  .data,
  start = "start_time",
  end = "end_time",
  variable = "variable",
  value = "value",
  tz_offset = "tz_offset"
)
Arguments
- .data
A data frame containing the wearable data.
- start
The name of the column containing start timestamps. Defaults to
"start_time".- end
The name of the column containing end timestamps. Defaults to
"end_time".- variable
The name of the column containing variable names. Defaults to
"variable".- value
The name of the column containing measurement values. Defaults to
"value".- tz_offset
The name of the column containing timezone offsets. Defaults to
"tz_offset".
Value
A ggplot2::ggplot object displaying cumulative step counts faceted by date.
See also
activity_chart() for activity types, activity_intensity_chart() for intensity
levels
Examples
steps_chart(dynamic_data)
#> Warning: Removed 1 row containing missing values or values outside the scale range
#> (`geom_segment()`).
#> Warning: Removed 1 row containing missing values or values outside the scale range
#> (`geom_segment()`).
#> Warning: Removed 1 row containing missing values or values outside the scale range
#> (`geom_segment()`).
#> Warning: Removed 1 row containing missing values or values outside the scale range
#> (`geom_segment()`).
#> Warning: Removed 1 row containing missing values or values outside the scale range
#> (`geom_segment()`).
#> Warning: Removed 1 row containing missing values or values outside the scale range
#> (`geom_segment()`).
#> Warning: Removed 1 row containing missing values or values outside the scale range
#> (`geom_segment()`).
#> Warning: Removed 1 row containing missing values or values outside the scale range
#> (`geom_segment()`).
#> Warning: Removed 1 row containing missing values or values outside the scale range
#> (`geom_segment()`).
#> Warning: Removed 1 row containing missing values or values outside the scale range
#> (`geom_segment()`).
#> Warning: Removed 1 row containing missing values or values outside the scale range
#> (`geom_segment()`).
#> Warning: Removed 1 row containing missing values or values outside the scale range
#> (`geom_segment()`).
#> Warning: Removed 1 row containing missing values or values outside the scale range
#> (`geom_segment()`).
#> Warning: Removed 1 row containing missing values or values outside the scale range
#> (`geom_segment()`).
#> Warning: Removed 1 row containing missing values or values outside the scale range
#> (`geom_segment()`).
#> Warning: Removed 15 rows containing missing values or values outside the scale range
#> (`geom_segment()`).